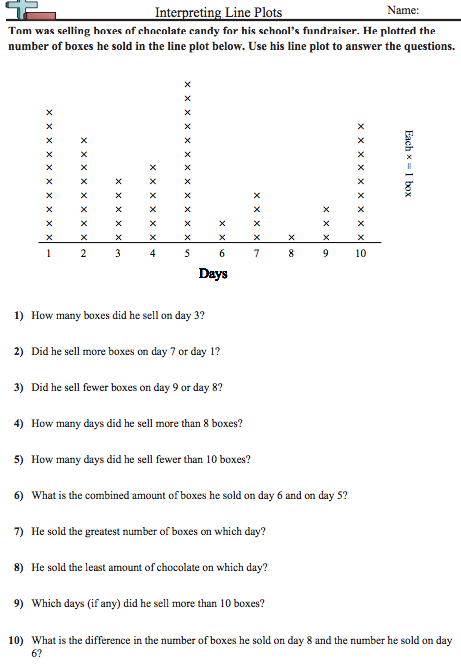
Level 1 - Line/Dot Plots
Watch the video below on creating dots plots.
Mandatory Conversation - Copy an example problem from the video above in your math notebook. Explain your understanding of the problem to the teacher.
Mandatory Task 1 ($100) - Correctly complete the dot plot worksheet. Show the teacher once you have finished this task!!!
Task 2 ($100) - Click the button below to log into Buzz Math. Go to the "assignments" tab and click on "building line plots." Correctly complete all 10 problems. Show the teacher once you have finished this task!!!
Task 3 ($100) - Correctly complete the dot plot worksheet. Show the teacher once you have finished this task!!!
Task 4 ($50) - Click the button below to log into Khan Academy. Search "creating dot plots" Get 3 problems correct in a row. Show the teacher once you have finished this task!!!
Task 5 ($50) - Click the button below to log into Khan Academy. Search "reading dot plots and frequency tables" Get 5 problems correct in a row. Show the teacher once you have finished this task!!!
Exit Slip
1. Create a statistical question. Collect 15 data points based on your statistical question. Create a dot plot to display the data that you collected.
Reteach - Follow the steps provided below
1. Select and watch one of the reteach videos provided below.
2. If you understand the concept then you can move on to the reteach tasks.
3. If you are still struggling to grasp the concept then choose a different reteach video to watch. Find the video that makes the most sense to you. Once you understand the concept then complete the reteach tasks.
|
|
Reteach Task 1 ($50) - Now that you have watched one or more of the instructional videos above create a dot plot using the following data. The temperatures, in degrees, for the first two weeks in July are given below:
89, 93, 91, 99, 98, 95, 101, 100, 90, 88, 85, 87, 90, 91
89, 93, 91, 99, 98, 95, 101, 100, 90, 88, 85, 87, 90, 91
Level 2 - Histograms
Watch the introductory video on histograms below.
enVision - Topic 8, Lesson 8-4, MathXL for School: Practice and Problem Solving
Mandatory Conversation - Copy an example problem from the video above in your math notebook. Explain your understanding of the problem to the teacher.
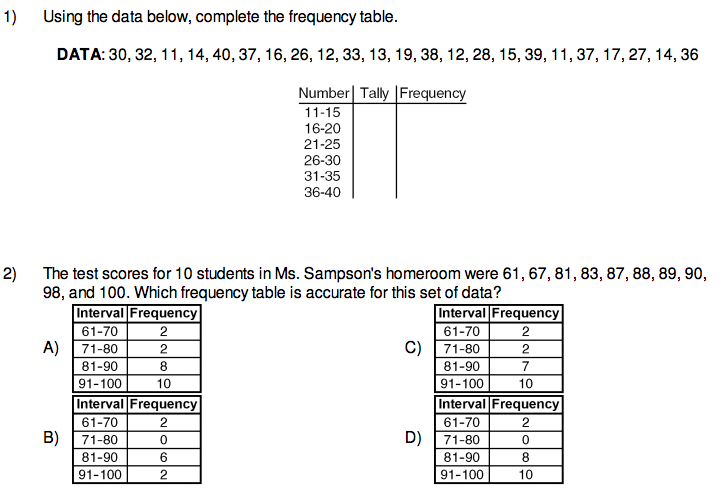
Mandatory Task 1 ($100) - Correctly complete the histogram worksheet. Show the teacher once you have finished this task!!!
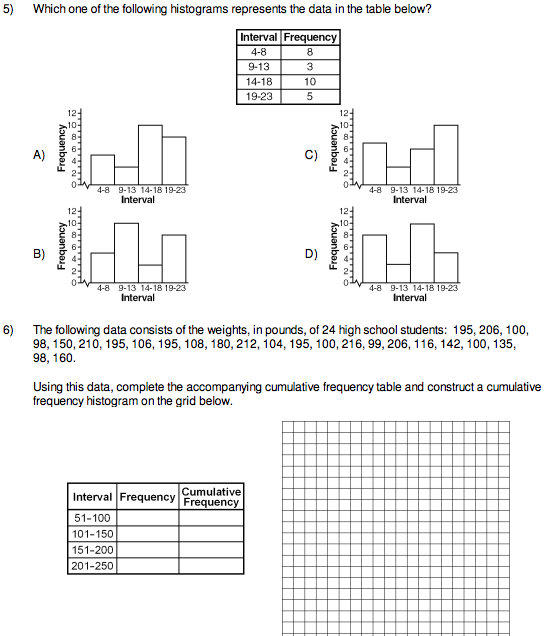
Mandatory Task 2 ($100) - Correctly complete the histogram worksheet. Show the teacher once you have finished this task!!!
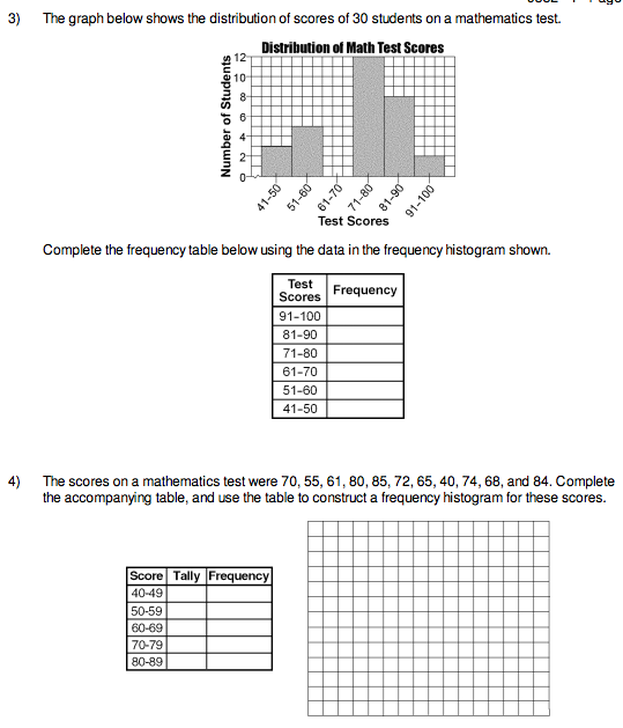
Task 3 ($50) - Correctly complete the histogram worksheet. Show the teacher once you have finished this task!!!
Task 4 ($50) - Click the button below to log into Buzz Math. Go to the "assignments" tab and click on "building histograms." Correctly complete all 8 problems. Show the teacher once you have finished this task!!!
Task 5 ($50) - Click the button below to log into Khan Academy. Search "creating histograms" Get 5 problems correct in a row. Show the teacher once you have finished this task!!!
Task 6 ($50) - Click the button below to log into Khan Academy. Search "reading histograms" Get 5 problems correct in a row. Show the teacher once you have finished this task!!!
Exit Slip
1. Create a statistical question. Collect 15 data points based on your statistical question. Create a histogram to display the data that you collected.
Reteach - Follow the steps provided below
1. Select and watch one of the reteach videos provided below.
2. If you understand the concept then you can move on to the reteach tasks.
3. If you are still struggling to grasp the concept then choose a different reteach video to watch. Find the video that makes the most sense to you. Once you understand the concept then complete the reteach tasks.
1. Select and watch one of the reteach videos provided below.
2. If you understand the concept then you can move on to the reteach tasks.
3. If you are still struggling to grasp the concept then choose a different reteach video to watch. Find the video that makes the most sense to you. Once you understand the concept then complete the reteach tasks.
Reteach Task 1 ($50) - Now that you have watched one or more of the instructional videos above create a histogram using the following data. You need to create at least 3 intervals. The temperatures, in degrees, for the first two weeks in July are given below:
89, 93, 91, 99, 98, 95, 101, 100, 90, 88, 85, 87, 90, 91
89, 93, 91, 99, 98, 95, 101, 100, 90, 88, 85, 87, 90, 91
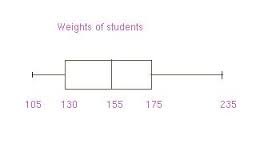
Level 3 - Box and Whisker Plots
Watch the introductory videos on creating box and whisker plots.
|
|
|
enVision - Topic 8, Lesson 8-3, MathXL for School: Practice and Problem Solving
Mandatory Conversation - Copy an example problem from the video above in your math notebook. Explain your understanding of the problem to the teacher.
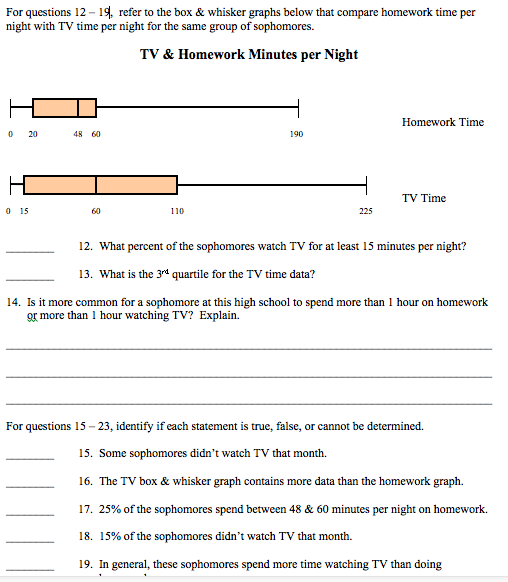
Mandatory Task 1 ($50) - Correctly complete the box and whisker worksheet. Show the teacher once you have finished this task!!!
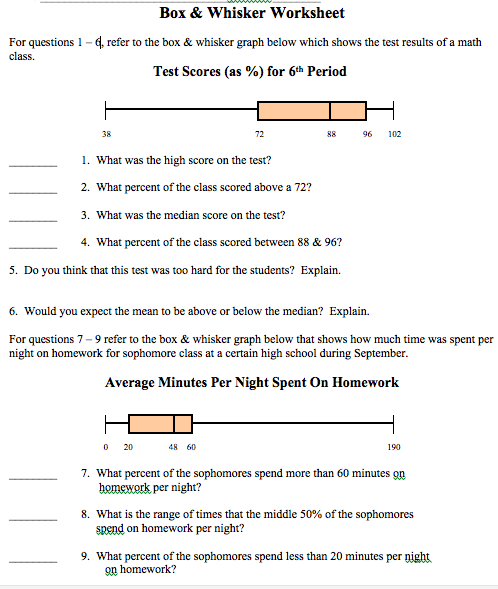
Mandatory Task 2 ($50) - Correctly complete the box and whisker worksheet. Show the teacher once you have finished this task!!!
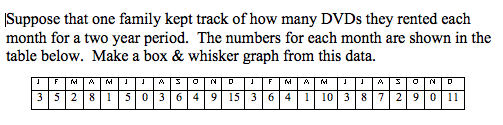
Mandatory Task 3 ($50) - Create a box and whisker plot from the data set given below. Show the teacher once you have finished this task!!!
Task 4 ($50) - Click the button below to log into Buzz Math. Go to the "assignments" tab and click on "calculating the range, interquartile range and interpreting box plots." Correctly complete all 10 problems. Show the teacher once you have finished this task!!!
Task 5 ($50) - Click the button below to log into Khan Academy. Search "creating box plots 1" Get 3 problems correct in a row. Show the teacher once you have finished this task!!!
Task 6 ($50) - Click the button below to log into Khan Academy. Search "reading box plots." Get 5 problems correct in a row. Show the teacher once you have finished this task!!!
Task 7 ($50) - Click the button below to log into Khan Academy. Search "calculating interquartile range." Get 5 problems correct in a row. Show the teacher once you have finished this task!!!
Exit Slip
1. Create a statistical question. Collect 15 data points based on your statistical question. Create a box plot to display the data that you collected.
Reteach - Follow the steps provided below
1. Select and watch one of the reteach videos provided below.
2. If you understand the concept then you can move on to the reteach tasks.
3. If you are still struggling to grasp the concept then choose a different reteach video to watch. Find the video that makes the most sense to you. Once you understand the concept then complete the reteach tasks.
1. Select and watch one of the reteach videos provided below.
2. If you understand the concept then you can move on to the reteach tasks.
3. If you are still struggling to grasp the concept then choose a different reteach video to watch. Find the video that makes the most sense to you. Once you understand the concept then complete the reteach tasks.
Reteach Task 1 ($50) - Now that you have watched one or more of the instructional videos above create a box plot using the following data. The temperatures, in degrees, for the first two weeks in July are given below:
89, 93, 91, 99, 98, 95, 101, 100, 90, 88, 85, 87, 90, 91
89, 93, 91, 99, 98, 95, 101, 100, 90, 88, 85, 87, 90, 91
Bonus Level
Task 1 ($500) - Develop your own research project by selecting a STATISTICAL QUESTION and collecting data related to the chosen question. You can select any statistical question you want that interests you (must be okayed by your teacher). Remember, a statistical question is one that has variability in the answer. BE CREATIVE!!! You need to survey at least 100 people. Make sure to keep your data organized!!! Once you have collected 100 data points you need to display the data by creating a dot plot, histogram, and box plot. Your final draft should be neat and organized. It should include all information along with headings and labels. Slop will not be excepted! Pretend you are presenting this information to the President of the United States. Get to thinking about what statistical question you want to ask and have fun with this!
Task 2 ($300) - enVision - Topic 8, Lesson 8-5, MathXL for School: Practice and Problem Solving
Task 3 ($300) - enVision - Topic 8, Lesson 8-6, MathXL for School: Practice and Problem Solving
Task 4 ($300) - enVision - Topic 8, Lesson 8-7, MathXL for School: Practice and Problem Solving
Task 5 ($300) - The weights for 20 students in a martial arts class are displayed below. Create a possible data set that would match the information in the box plot below.